When Kingston came up with the KC3000 SSD back last year, it was one of the fastest SSD we have tested so far. The fury Renegade SSD doesn’t particularly bring anything new components wise but through some tinkering here and there Kingston has revised the KC 3000 into something more powerful. How much powerful? that we will see later in the review.
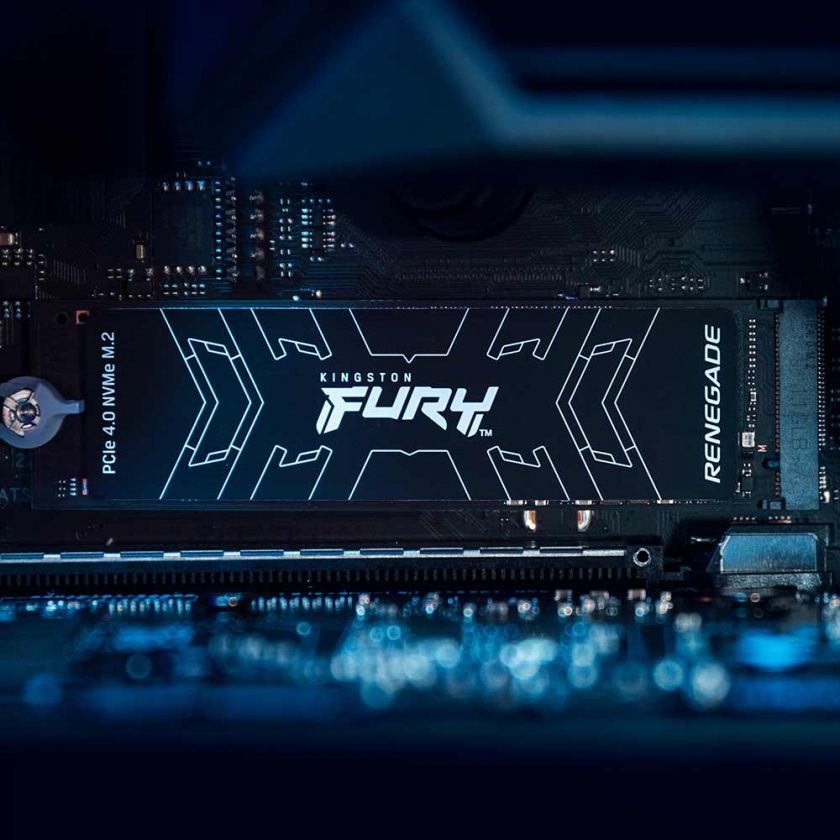
Built on the same base as KC3000, the fury Renegade uses the same Phison E18 controller with Micron 176L TLC NAND. The firmware is tweaked to give a bit more oomph, pushing the speeds up to 7.3 Gbps of bandwidth, a 300 MBps increase, and up to 1 million IOPS over the PCIe 4.0 interface. The endurance gets a nice bump to 1 petabyte-written-per-TB. Another key difference is that the FURY Renegade is marketed as a “Gaming SSD” and compatible with PS5; although there is no heatsink for PS5 in the package.
| Kingston Fury Renegade SSD Specifications | ||||
|---|---|---|---|---|
| Product | 500GB | 1TB | 2TB | 4TB |
| Pricing | $102.99 | $164.99 | $359.99 | $1,027.93 |
| Capacity (User / Raw) | 500GB / 512GB | 1000GB / 1024GB | 2000GB / 2048GB | 4000GB / 4096GB |
| Form Factor | M.2 2280 | M.2 2280 | M.2 2280 | M.2 2280 |
| Interface / Protocol | PCIe 4.0 x4 / NVMe 1.4 | PCIe 4.0 x4 / NVMe 1.4 | PCIe 4.0 x4 / NVMe 1.4 | PCIe 4.0 x4 / NVMe 1.4 |
| Controller | Phison PS5018-E18 | Phison PS5018-E18 | Phison PS5018-E18 | Phison PS5018-E18 |
| DRAM | DDR4 | DDR4 | DDR4 | DDR4 |
| Memory | Micron 176L TLC | Micron 176L TLC | Micron 176L TLC | Micron 176L TLC |
| Sequential Read | 7,300 MBps | 7,300 MBps | 7,300 MBps | 7,300 MBps |
| Sequential Write | 3,900 MBps | 6,000 MBps | 7,000 MBps | 7,000 MBps |
| Random Read | 450,000 IOPS | 900,000 IOPS | 1,000,000 IOPS | 1,000,000 IOPS |
| Random Write | 900,000 IOPS | 1,000,000 IOPS | 1,000,000 IOPS | 1,000,000 IOPS |
| Security | N/A | N/A | N/A | N/A |
| Endurance (TBW) | 500 TB | 1,000 TB | 2,000 TB | 4,000 TB |
| Part Number | SFYRS/500G | SFYRS/1000G | SFYRD/2000G | SFYRD/4000G |
| Warranty | 5-Years | 5-Years | 5-Years | 5-Years |
Test Setup
We requested the folks from Tuktak Tech community to handle the testing along with us as a collabo and they graciously accepted. The test rigs are from them and the effort is joint and the result was fun! Go check them out on Youtube, you will not be disappointed!
| Processor | Ryzen 9 3900X |
|---|---|
| Motherboard | MSI MPG B550 Gaming Plus |
| Memory | 4x16GB 3600 MHz (16-19-19-39) Trident Z Neo (Dual Rank SK Hynix) |
| Graphics Card | Colorful iGame Geforce RTX 3060 TI Ultra OC |
| Storage | KINGSTON FURY RENEGADE 2TB |
| Power Supply | Deepcool DQ850M-V2-L |
With the setup ready to go..we ran the Fury Renegade through our usual gauntlet.
Atto Disk Benchmark
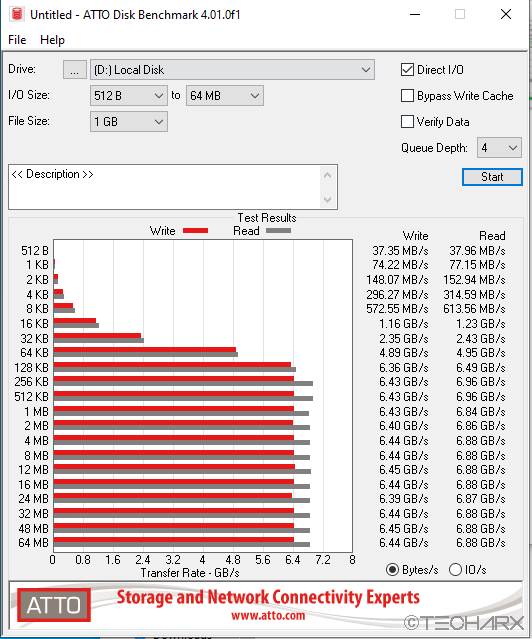
The great thing about ATTO is that one can test with predefined block sizes. So, we can test with a 32MB sequence of 4KB files, yet also 32MB in 1MB files, providing an opportunity to test with various file sizes. This benchmark is preferred among manufacturers as ATTO uses RAW or compressible data and, for our benchmarks, we used a set length of 256mb and tested both the Read and Write performances for various transfer sizes ranging from 0.5 to 8192kb with a user-selected queue depths.
We see the drive almost hitting the advertised numbers, a little bit of throttling comes into play due to the ambience temperature.
CRYSTAL DISK Benchmark
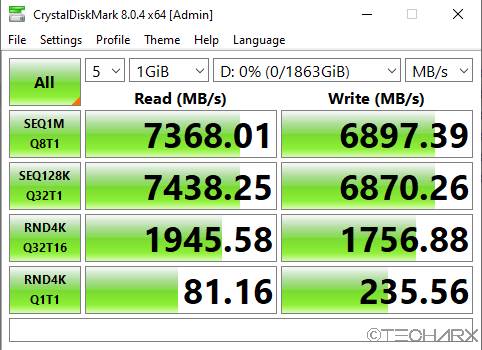
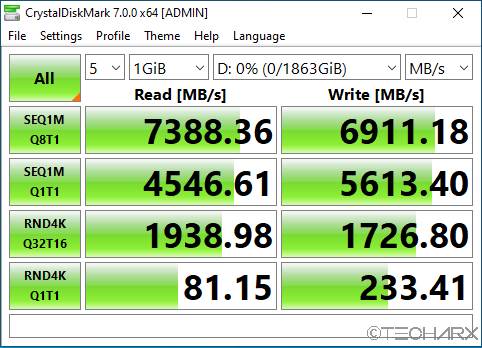
Crystal Disk Benchmark is used to measure read and Write performances through the sampling of highly compressible data (oFill/1Fill), or random data. Crystal Disk Mark scores usually drop a bit compared to ATTO, and this is the result of the test data now being primarily incompressible – Mostly movies, music, and photographs. We tested the drive with 1 GiB Sample with and without the heatsink that came with the motherboard.
In Crystal diskmark though, we see the drives working well beyond our expectations.
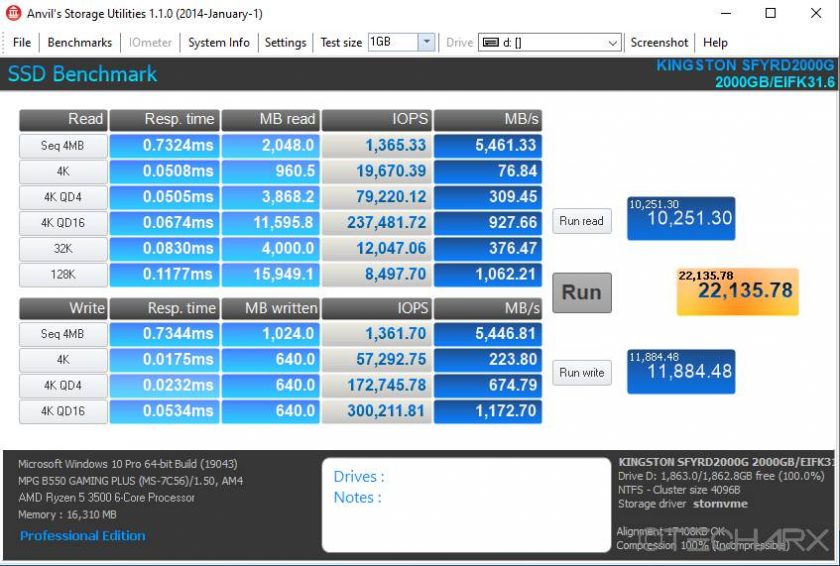
Anvil’s Storage utilities Benchmark
Anvil Pro or Anvil’s Storage Utilities[Depending on what you’d want to call it] is an ‘all-inclusive’ storage utility that allows testing transfer speeds as well as IOPS and lets the user tweak and adjust to find just the right mix in their testing medium, the IOPS tests being fully configurable with preset testing scenarios for read, write and mixed IO. The Benchmarks menu includes an SSD test, Endurance Testing, and 3 pre-configured IOPS tests.
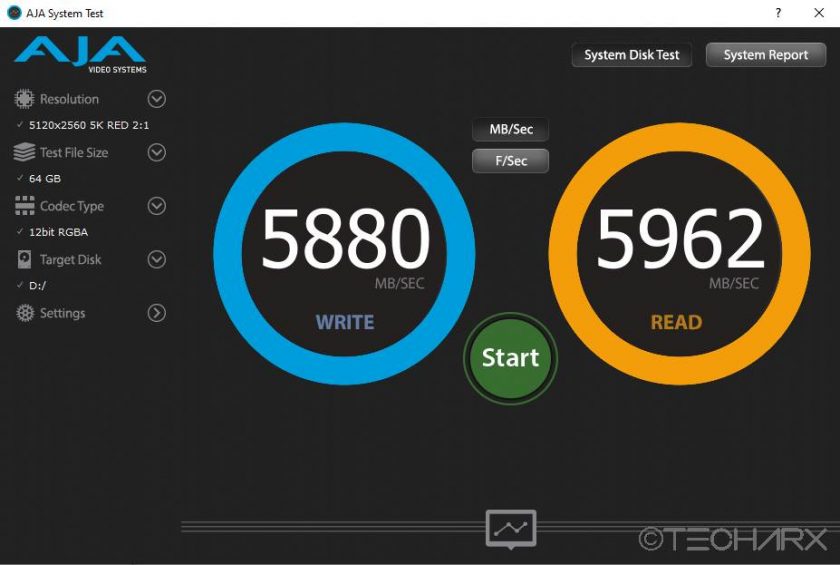
AJA System Test
AJA system test is used to benchmark the performance of a drive for video production workflow across various codecs with different settings.
AS SSD benchmark Suite
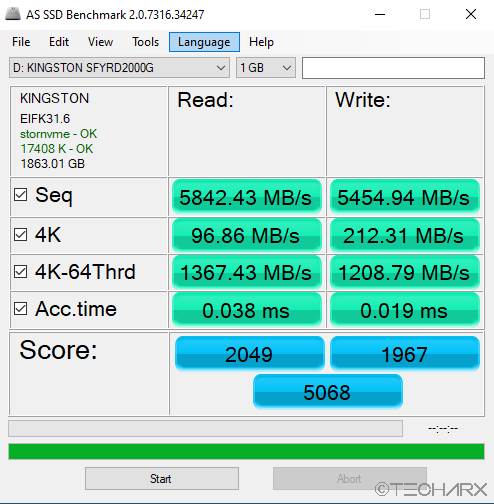
Last but not least is AS SSD Benchmark. This nice little German application gives an extensive result set. The test is popular, so I included it. AS SSD, for the most part, gives us the worst-case scenario in SSD transfer speeds because of its use of incompressible data.
Conclusion
We tested the Kingston KC3000 in December last year and were presently surprised by its performance. The KC3000 quickly became the leader among the SSDs we tested (and we tested a lot of them!). Kingston FURY Renegade SSD builds on the base that KC3000 provides and with careful tinkering brings out a winner in my books. One more notable thing is overprovisioning, which is a double-edged sword as it reduces the amount of usable capacity but as the drive gets filled to capacity (which is a gaming drives destiny), the speed boost will become more apparent. Couple that with the endurance numbers, we have a very capable drive in our hands. The price is as always a bit on the higher side, but that shouldn’t deter you since the long warranty more than makes up for it.
Overall, the FURY RENEGADE is a very compelling choice if you are shopping around for a new PCIe 4.0 drive.
A gold from TechARX


